What are AFM phase images?​

What are AFM phase images?

A phase image of a polymer composite collected with the nGauge AFM.

An atomic force microscope (AFM) uses a tiny probe tip to scan across the surface of a sample and generates a 3-d representation of the surface topography, often called the topography image.

Another type of image, the phase image, can be generated in addition to the topography image when the AFM is operated in a mode called tapping mode. Tapping mode is a non-contact mode where the cantilever oscillates above the sample surface.

The nGauge AFM operates in tapping mode and generates topography and phase images simultaneously. Phase imaging is included with all nGauge AFMs.

In this blog post, we’re going to discuss:

  • What is the phase or phase shift of the signal
  • What phase images are and how they are generated
  • How phase images can be used in research, teaching and industrial applications
 
Phase Theory

The most common mode of operation for AFM is in tapping mode, where the cantilever is driven to oscillate near its resonant frequency so that it ‘taps’ the sample surface.

In tapping mode, the feedback signal to the controller is the oscillation amplitude of the tip. A simplified way to think about this is: as the tip approaches a raised part or bump in the sample, it has less room to oscillate, and the amplitude decreases. In response to the change in amplitude, the controller moves the tip up so that the amplitude goes back to the set-point.

The change in height of the tip is correlated to the change in height of the sample topography.

Along with the amplitude, the frequency of the signal in relation to the driving frequency, which is the ‘phase’ or ‘phase shift’ of the signal.

Change in amplitude
Phase shift

We know that the amplitude generates the topography image, what kind of information does the phase image give us?

The phase depends on the interaction between the tip and surface. Depending on the properties of the surface, such as adhesive, stiffness or frictional properties, the interaction between the tip and surface will cause the oscillation to lag (in other words, a phase shift).

To illustrate this point, let’s imagine a surface that is made up of two different components (blue and red) and that the surface is perfectly flat: this means that there is no change in topography between the blue and red components and the amplitude remains completely constant throughout the scan.

The surface is perfectly flat: the oscillation amplitude remains constant so the topography remains constant as well. (Idealized scenario.)

However, the blue and red components possess different mechanical properties. For example, imagine that the red material has stronger adhesive properties than the blue material, which causes the tip-surface interaction to be different. That is why although the signal’s amplitude remains constant, the phase does change.

The red and blue components possess different mechanical properties, which results in a different phase shift. (Idealized scenario.)
Phase Images

Regions with different mechanical properties can be distinguished using the contrast of the phase image with extremely high lateral resolution. 

Since the topography image and the phase image are generated at the same time, analysis of both images side by side can reveal information that might be hidden from just the topography image alone.

Below is an example of the topography (left) and phase (right) images of a silica-polymer composite. On the left, you can see a few particles that are protruding from the surface. They are bright in the topography image because they are the tallest features.

It’s unclear what the structure or morphology is of the rest of the image. The phase image on the right makes it clear which areas are silica: the dark areas represent regions with a low phase shift (around -50°). The light areas possess a much higher phase shift (around 30°) and they represent the polymer matrix. This is because the silica particles possess very different properties compared to the polymer matrix.

Topography image of a silica-polymer composite.
Corresponding phase image of the silica-polymer composite.
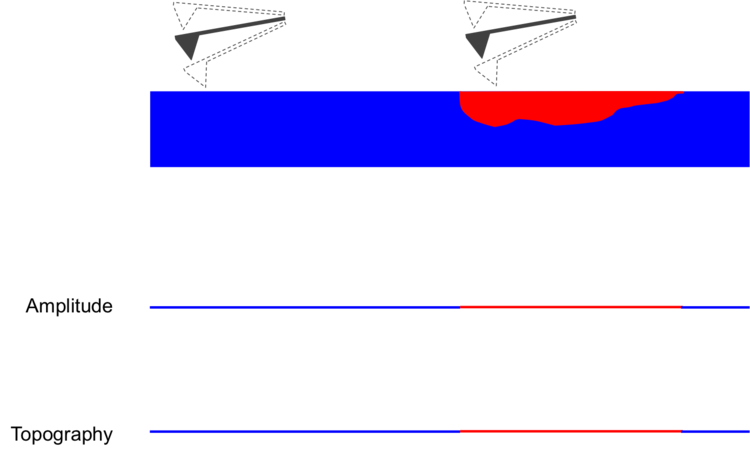
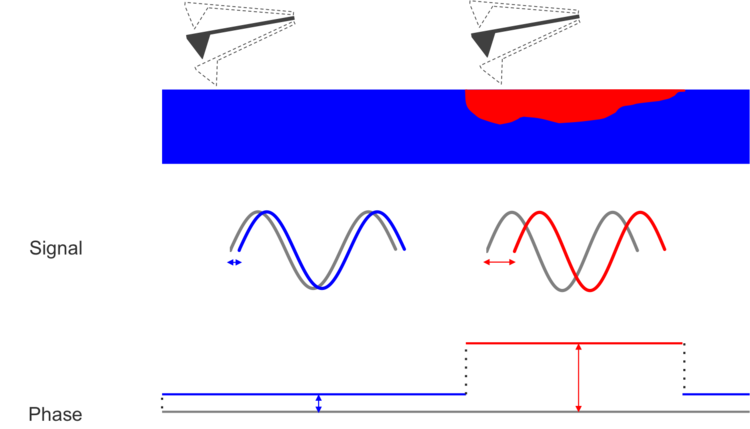
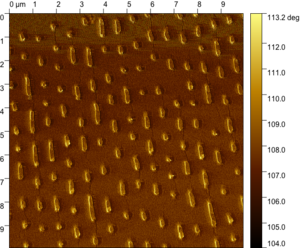
Phase images can be used to identify which regions possess different properties, such as adhesive, viscoelastic, stiffness or frictional, which might be hidden in the topography image.
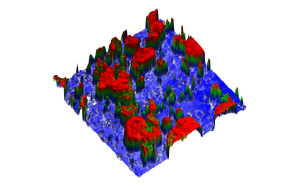
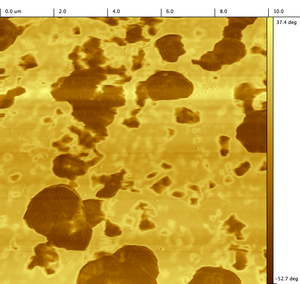
There are many applications of phase images. For example, they can be used to identify regions of contamination, different components in composites (like the example above), different polymers in copolymers, grain boundaries, among many other possibilities.
Contact Area

The phase shift also depends on the contact area between the tip and the sample. If the sample is perfectly flat and uniform, there won’t be much change in phase, but the phase will be slightly different along the edges of features because of the slope (a greater slope results in less contact area between the tip and surface).

To illustrate this, below are the topography and phase images of a DVD. The DVD is composed of the same material throughout the entire scan so we don’t expect a change in phase as the material properties should be the same. The phase image does show a slight difference in the phase along the edges of the pits (around 113° instead of 108°), because of the reduced contact area between the tip and the sample. The phase looks to be about the same value inside the pits as it is outside of the pits because the tip-sample contact area is about the same.

Topography image of a DVD.
Corresponding phase image of a DVD.
Conclusion

Differences in a phase image often show some kind of boundary: a material boundary, a grain boundary, or the edge of a particle, among many other possibilities. Phase images can give information that might be hidden in a topographic image, but because there are so many factors affecting the phase, information from a phase image is often qualitative and not quantitative.

Interested in learning more about AFM phase imaging?

Contact us and an application engineer would be happy to discuss what you’re working on.

Scroll to Top